
How it works

From your data to a defensible decision.

  • No complex integrations to begin
  • Standard data templates
  • Quick data imports
01 Measure02 Quantify03 Identify04 Optimize
01

PHASE 1

Measure

Your data becomes one reconciled, measured picture of the whole network.

01

Start from what you have

Standard exports from your ERP and plant systems are enough to begin.

02

Validated on the way in

Every dataset is checked as it arrives, and the platform shows what it unlocks.

03

Gaps filled, and labelled

Missing data is filled with documented defaults, labelled as derived until the real data arrives.

04

One basis for every number

Plants, lines, machines, products, customers, and shipments reconciled onto one basis.
02

PHASE 2

Quantify

Every hour and every unit, quantified on one basis: your own contribution margin.

05

Capacity, two ways

Utilization against the theoretical ceiling and against your own schedule.

06

Where the hours go

Available time traced through scheduling, downtime, speed, and yield.

07

Revenue to margin

Revenue traced through materials, labour, and overhead to contribution margin.

08

Losses in dollars

Scheduling gaps and downtime valued at each plant's own margin per hour.

03

PHASE 3

Identify

The platform asks the questions a spreadsheet never gets to, and lets your team ask their own.

09

Opportunities, quantified

Pricing, consolidation, renewal, portfolio, and risk opportunities, each sized in dollars.

10

Complexity made visible

Every line and account scored for the variety and changeovers that erode margin.

11

Your own questions

Filter, rank, and position any plant, line, product, or customer on any measure.

12

Demand you could win

Customer demand within reach of each plant, matched to what it can make.

04

PHASE 4

Optimize

Test the move on the network before capital is committed.

13

Rehearse the change

Move production or change a schedule on a digital twin and see the effect first.

14

Search the whole network

Mathematical optimization across every plant and lane, scenarios side by side.

15

Make the case

A multi-year investment case to NPV, IRR, and payback.

16

Keep the evidence

Every recommendation carries its sources, assumptions, and test scenario.

Built for trust

Every finding keeps its chain of custody.

  • 01The source records it came from
  • 02The calculation that produced it
  • 03The metrics it derived
  • 04The scenario it was tested against
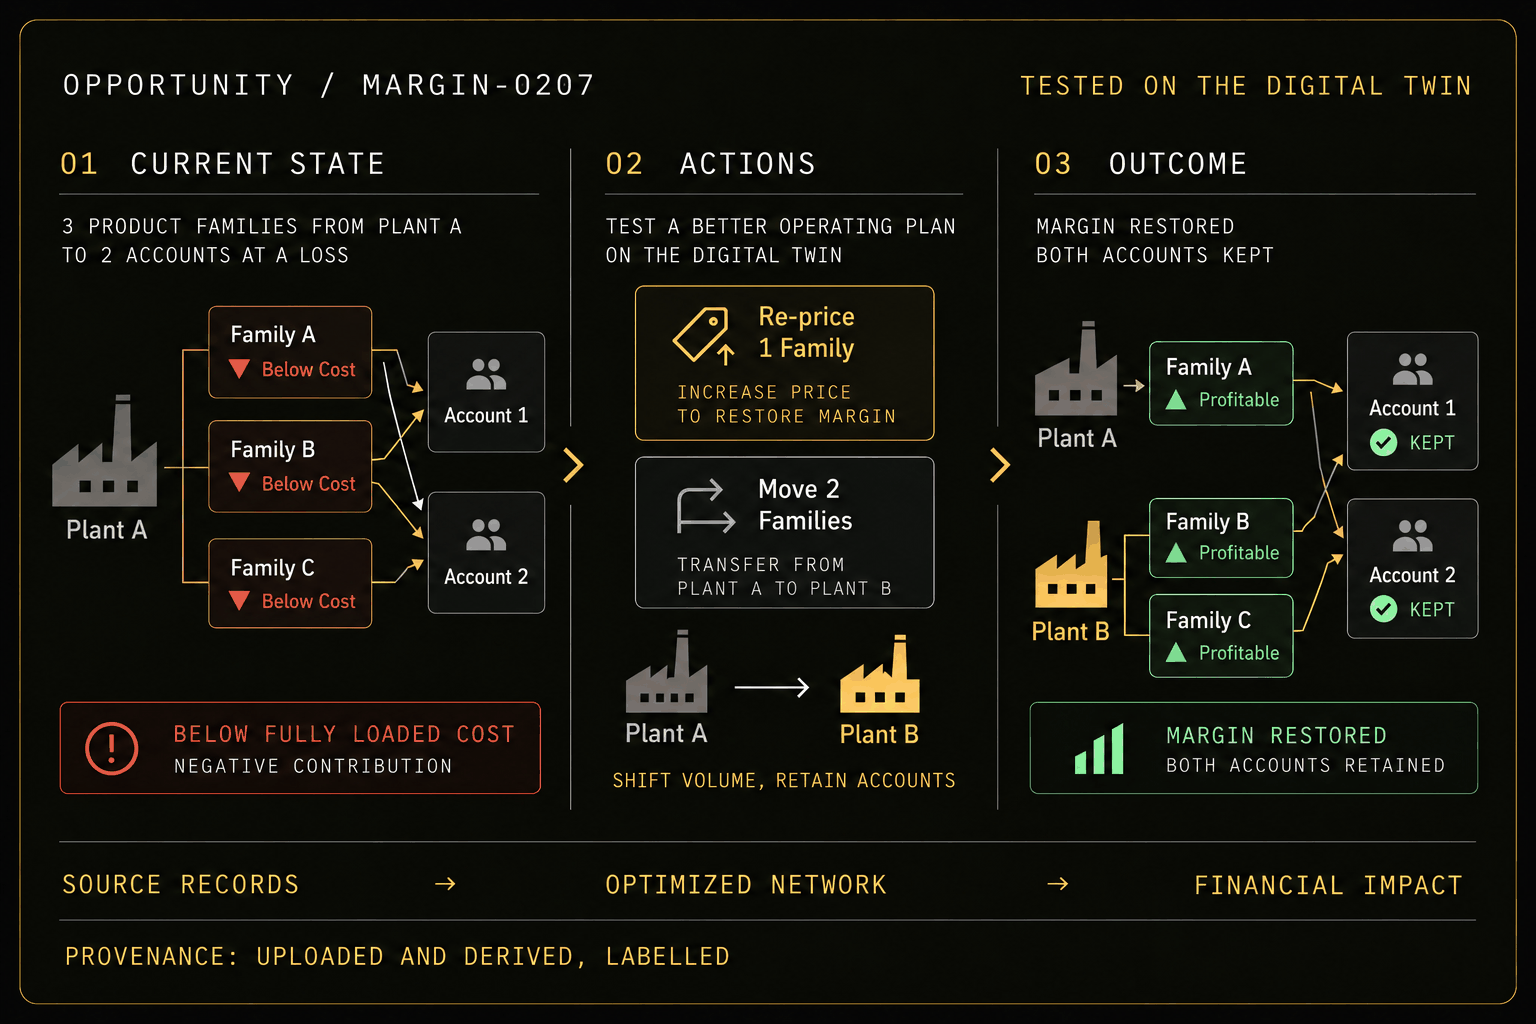
Opportunity MARGIN-0207, tested on the digital twin. Current state: three product families from Plant A ship to two accounts below fully loaded cost. Actions: re-price one family and move two families from Plant A to Plant B. Outcome: margin restored, both accounts kept. Source records to optimized network to financial impact; provenance uploaded and derived, labelled.

See the method run on a plant like yours.